
GPT-2 Images Prompt Style Library
Click on the images to get the full prompt. You can use these prompts on reference photos or add text descriptions of what is being depicted. For use in ChatGPT Images.
Images


Infographics
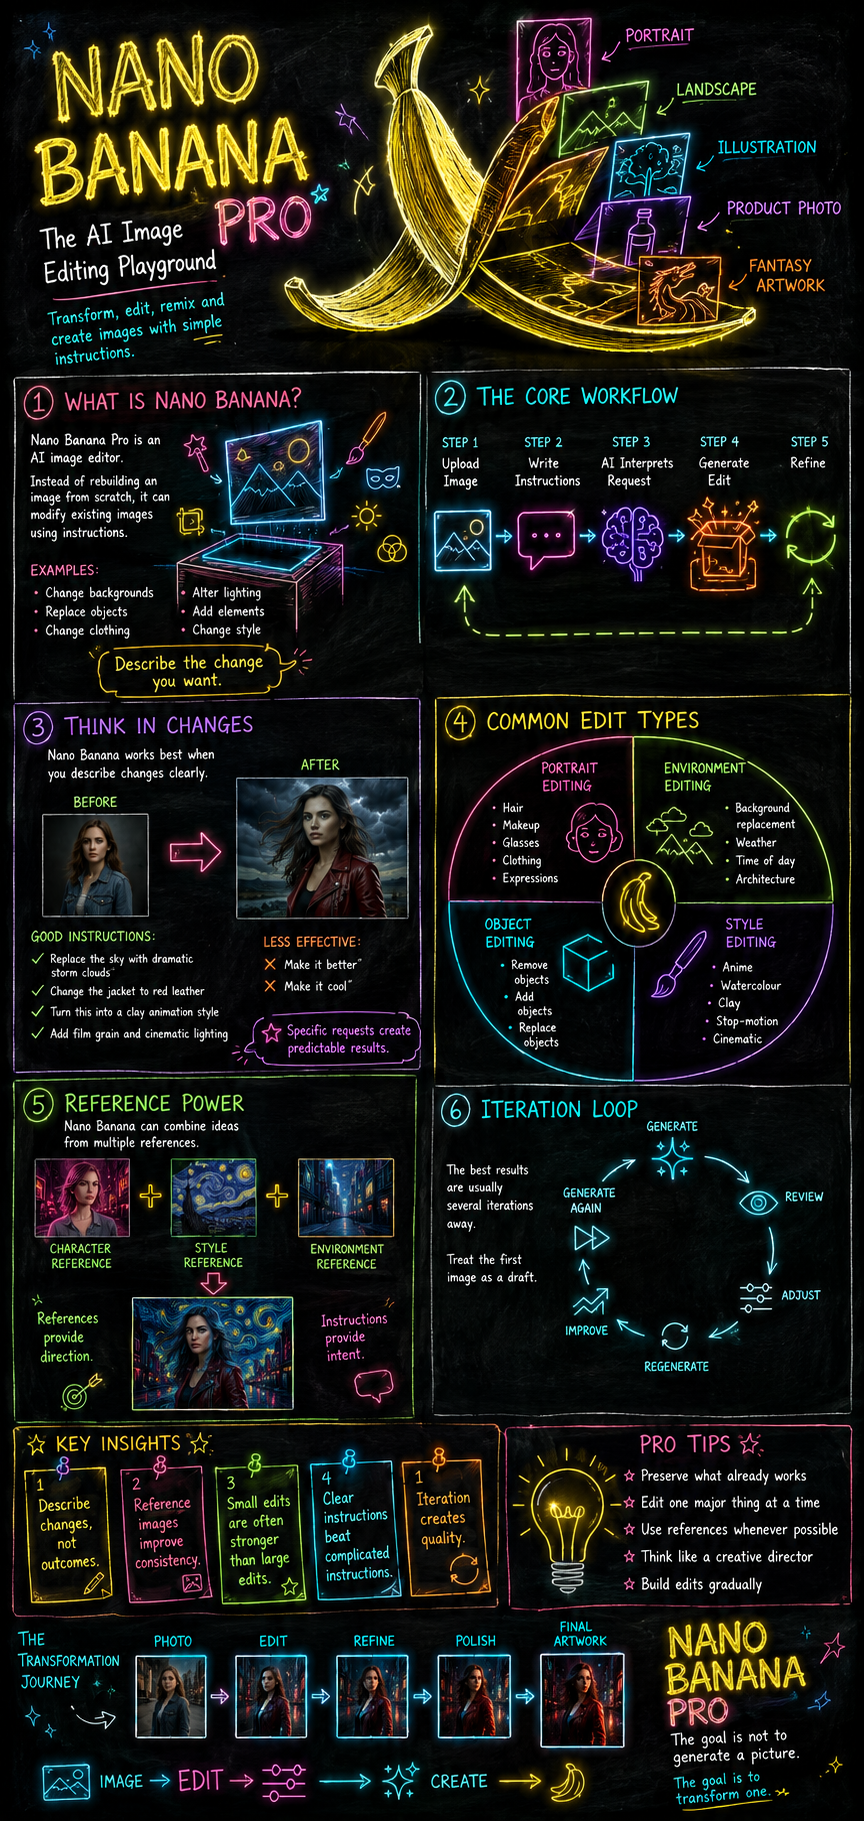
Create a highly detailed educational infographic presented on a large blackboard background.
STYLE
Matte black chalkboard surface
Hand-drawn neon chalk illustrations
Glowing handwritten typography
Bright neon colours: cyan, magenta, electric blue, neon green, orange, purple, yellow, and pink
Soft luminous glow around all writing and illustrations
Clean visual hierarchy
Professional educational poster design
Modern science-museum aesthetic
Large readable text
High contrast
Vertical infographic layout
Premium presentation quality
VISUAL CONCEPT
The entire infographic should appear as though an expert has spent hours carefully drawing and explaining the subject on a giant blackboard using glowing neon chalk.
Combine:
Neon diagrams
Flow arrows
Sketches
Callout boxes
Labels
Icons
Step-by-step visual explanations
Use visual storytelling throughout.
━━━━━━━━━━━━━━━━━━
TITLE
[INSERT TITLE]
Subtitle:
[INSERT SUBTITLE]
Central Idea:
[INSERT MAIN CONCEPT OR THESIS]
Visual:
Large glowing neon illustration representing the core concept.
━━━━━━━━━━━━━━━━━━
SECTION 1
[SECTION TITLE]
Visual:
[DESCRIBE VISUAL]
Explanation:
[INSERT SUMMARY]
Key Points:
• [POINT 1]
• [POINT 2]
• [POINT 3]
Use arrows and neon annotations to connect ideas.
━━━━━━━━━━━━━━━━━━
SECTION 2
[SECTION TITLE]
Visual:
[DESCRIBE VISUAL]
Explanation:
[INSERT SUMMARY]
Key Points:
• [POINT 1]
• [POINT 2]
• [POINT 3]
Include labelled neon diagrams.
━━━━━━━━━━━━━━━━━━
SECTION 3
[SECTION TITLE]
Visual:
[DESCRIBE VISUAL]
Explanation:
[INSERT SUMMARY]
Key Points:
• [POINT 1]
• [POINT 2]
• [POINT 3]
Show relationships using glowing pathways and connecting arrows.
━━━━━━━━━━━━━━━━━━
PROCESS / WORKFLOW
Visual:
Large neon flowchart spanning the width of the infographic.
Steps:
[STEP]
↓
[STEP]
↓
[STEP]
↓
[STEP]
↓
[STEP]
Each step represented by a unique neon icon.
━━━━━━━━━━━━━━━━━━
KEY INSIGHTS
Represent these as large neon callout boxes.
Insight 1:
[INSERT INSIGHT]
Insight 2:
[INSERT INSIGHT]
Insight 3:
[INSERT INSIGHT]
Insight 4:
[INSERT INSIGHT]
Insight 5:
[INSERT INSIGHT]
━━━━━━━━━━━━━━━━━━
COMMON MISTAKES
Visual:
Warning symbols drawn in neon orange.
• [MISTAKE]
• [MISTAKE]
• [MISTAKE]
Include corrective notes beside each one.
━━━━━━━━━━━━━━━━━━
CONCLUSION
Visual:
Large glowing summary illustration combining the major concepts.
Summary:
[INSERT CONCLUSION]
Final Takeaway:
[INSERT MOST IMPORTANT MESSAGE]
━━━━━━━━━━━━━━━━━━
DESIGN NOTES
Blackboard remains visible throughout
Neon chalk texture on all illustrations
Hand-drawn educational aesthetic
Dense but organized information
Consistent colour coding
Clear visual flow from top to bottom
Every major idea represented visually
Infographic should feel like a masterclass taught by a brilliant instructor using glowing chalk
Museum-quality educational design
Ultra-detailed
Crisp typography
Print-ready composition
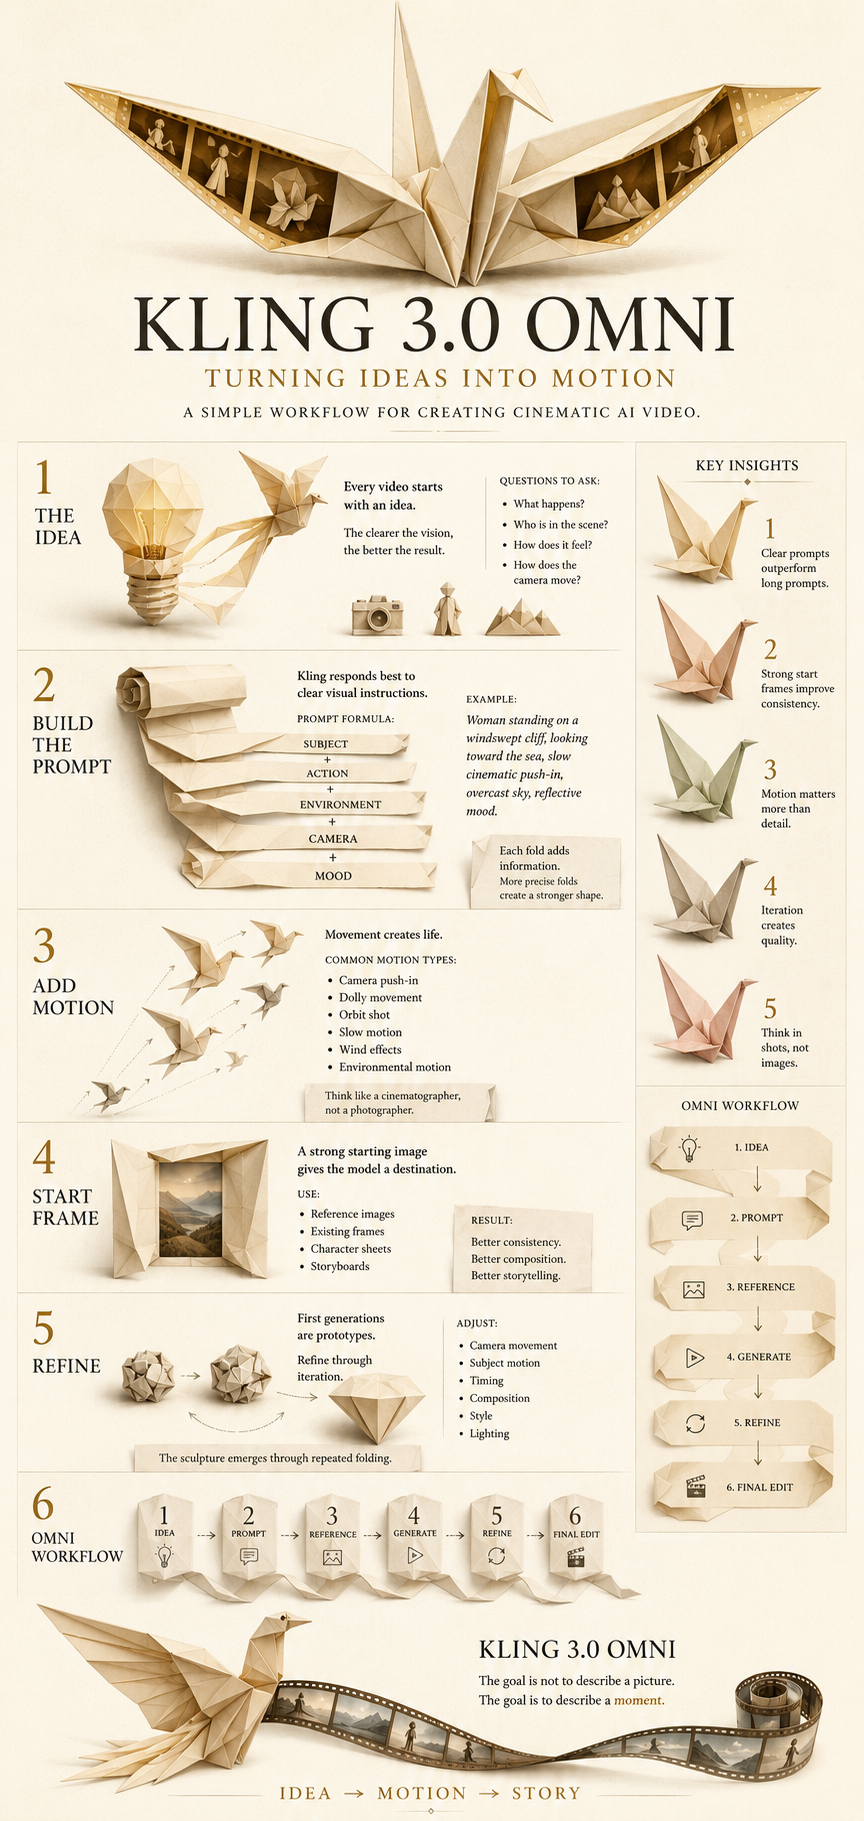
Create a clean, elegant infographic that visually explains the key ideas from the essay below using an origami-inspired visual language.
STYLE & DESIGN
Minimalist editorial infographic design
Warm cream paper background
Sophisticated origami illustrations throughout
Folded paper aesthetic with visible creases and geometric forms
Soft shadows and subtle paper texture
Limited colour palette: cream, ivory, soft beige, muted gold, dusty rose, pale sage, and charcoal accents
Plenty of negative space
Modern museum exhibition graphic design
High readability
Premium print-quality layout
Clean hierarchy and information architecture
Beautiful balance between text and imagery
Vertical infographic format
VISUAL CONCEPT
Represent concepts, themes, ideas, emotions, arguments, and transitions as origami objects.
Examples:
Ideas = folded paper birds
Growth = unfolding origami flower
Conflict = torn or folded paper intersections
Transformation = paper morphing between shapes
Relationships = interconnected folded structures
Journey = trail of folded paper elements
Hope = ascending paper cranes
Knowledge = unfolding paper map
Memory = folded paper lanterns
ESSAY CONTENT
Title:
[INSERT ESSAY TITLE]
Subtitle:
[INSERT OPTIONAL SUBTITLE]
Core Thesis:
[INSERT MAIN ARGUMENT OR CENTRAL IDEA]
INTRODUCTION
Summary:
[INSERT INTRODUCTION SUMMARY]
Key Points:
[POINT 1]
[POINT 2]
[POINT 3]
SECTION 1
Heading:
[SECTION TITLE]
Summary:
[SECTION SUMMARY]
Supporting Ideas:
[IDEA A]
[IDEA B]
[IDEA C]
Important Quote:
"[INSERT QUOTE]"
SECTION 2
Heading:
[SECTION TITLE]
Summary:
[SECTION SUMMARY]
Supporting Ideas:
[IDEA A]
[IDEA B]
[IDEA C]
Important Quote:
"[INSERT QUOTE]"
SECTION 3
Heading:
[SECTION TITLE]
Summary:
[SECTION SUMMARY]
Supporting Ideas:
[IDEA A]
[IDEA B]
[IDEA C]
Important Quote:
"[INSERT QUOTE]"
KEY INSIGHTS
Present these as visually prominent origami structures:
[INSIGHT 1]
[INSIGHT 2]
[INSIGHT 3]
[INSIGHT 4]
[INSIGHT 5]
CONCLUSION
Summary:
[INSERT CONCLUSION]
Final Takeaway:
[INSERT SINGLE MOST IMPORTANT MESSAGE]
INFOGRAPHIC REQUIREMENTS
Convert abstract ideas into origami metaphors
Use flow lines made from folded paper strips to connect sections
Include simple icons created from folded paper forms
Avoid clutter
Prioritize visual storytelling over dense text
Create a sense of progression from top to bottom
Make it feel like a gallery-quality educational poster
Elegant, calm, intelligent, artistic
No stock illustration style
No corporate design language
High-end editorial infographic aesthetic
Ultra-detailed paper craftsmanship
Crisp typography
Print-ready composition
Symmetrical educational infographic, meticulously organized visual hierarchy, centered composition, geometric layout system, retro-academic design language, curated pastel colour palette, muted vintage tones, cream, powder blue, dusty pink, sage green and mustard accents, clean typography blocks, modular information panels, labelled diagrams, numbered sections, elegant iconography, precise spacing, balanced proportions, mid-century educational poster aesthetic, museum exhibit design, archival print quality, handcrafted illustration details, playful but highly structured presentation, visual clarity, tidy data visualization, subtle paper texture, crisp linework, gentle shadows, editorial sophistication, nostalgic institutional graphics, infographic elements arranged with mathematical precision, charming educational atmosphere, premium publication design, immaculate alignment, understated humour, timeless visual appeal, high readability, decorative borders, carefully framed callout boxes, diagrammatic storytelling, rich detail without clutter, polished print-production quality.
Layout includes clearly marked placeholder content throughout:
[MAIN TITLE]
[SUBTITLE OR TAGLINE]
[INTRODUCTION PANEL]
Short paragraph placeholder describing the topic.
[KEY STATISTIC]
Large highlighted number placeholder.
[SECTION 1 TITLE]
Supporting text placeholder.
Illustration placeholder.
Key point placeholder.
[SECTION 2 TITLE]
Supporting text placeholder.
Diagram placeholder.
Key point placeholder.
[SECTION 3 TITLE]
Supporting text placeholder.
Process illustration placeholder.
Key point placeholder.
[COMPARISON PANEL]
Category A placeholder.
Category B placeholder.
Category C placeholder.
[TIMELINE]
Milestone 1 placeholder.
Milestone 2 placeholder.
Milestone 3 placeholder.
Milestone 4 placeholder.
[DATA VISUALISATION AREA]
Chart placeholder.
Graph placeholder.
Legend placeholder.
[KEY TAKEAWAYS]
Bullet point placeholder.
Bullet point placeholder.
Bullet point placeholder.
[FOOTER]
Sources placeholder.
Notes placeholder.
Website placeholder.
All placeholder text rendered as realistic infographic copy blocks and labels rather than lorem ipsum, maintaining perfect alignment and visual consistency. The infographic should look fully designed and publication-ready, while clearly containing editable placeholder content ready for replacement.